
Annual review 2024
Abridged financials 2024
Consolidated statement of financial position as at 31 December 2024
| 2024
$’000 |
2023
$’000 |
|
| ASSETS | ||
| CURRENT ASSETS | ||
| Cash and cash equivalents | 509 | 2,123 |
| Trade and other receivables | 3,844 | 1,300 |
| Other assets | 458 | 168 |
| TOTAL CURRENT ASSETS | 4,811 | 3,591 |
| NON-CURRENT ASSETS | ||
| Financial assets | 27,989 | 32,035 |
| Property, plant and equipment | 13,454 | 7,151 |
| Right-of-use assets | 13,302 | 11,070 |
| Trade and other receivables | 0 | 121 |
| TOTAL NON-CURRENT ASSETS | 54,745 | 50,377 |
| TOTAL ASSETS | 59,556 | 53,968 |
| LIABILITIES | ||
| CURRENT LIABILITIES | ||
| Trade and other payables | 3,529 | 4,738 |
| Employee benefits | 2,285 | 2,357 |
| Lease liability | 1,119 | 944 |
| TOTAL CURRENT LIABILITIES | 6,933 | 8,039 |
| NON-CURRENT LIABILITIES | ||
| Lease liability | 13,137 | 10,539 |
| Borrowings | 10,495 | 5,083 |
| Employee benefits | 272 | 205 |
| TOTAL NON-CURRENT LIABILITIES | 23,904 | 15,827 |
| TOTAL LIABILITIES | 30,837 | 23,866 |
| NET ASSETS | 28,719 | 30,102 |
| EQUITY | ||
| Reserves | 21,791 | 19,352 |
| Retained earnings | 6,928 | 10,750 |
| TOTAL EQUITY | 28,719 | 30,102 |
Consolidated statement of profit or loss and other comprehensive income for the year ended 31 December 2024
| 2024
$’000 |
2023
$’000 |
|
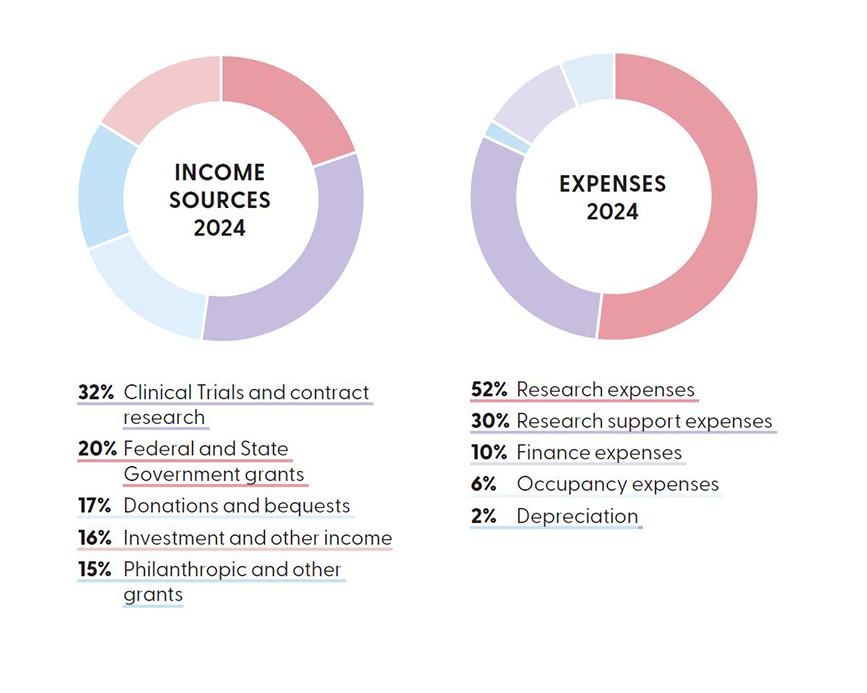
| REVENUE | ||
| Federal and State Government grants | 5,050 | 6,838 |
| Clinical Trials and contract research | 8,224 | 6,356 |
| Donations and bequests | 4,181 | 4,151 |
| Philanthropic and other grants | 3,745 | 2,101 |
| Investment and other income | 4,002 | 3,608 |
| TOTAL REVENUE | 25,202 | 23,054 |
| EXPENSES | ||
| Research expenses | (13,803) | (14,076) |
| Research support expenses | (7,923) | (6,165) |
| Occupancy expenses | (508) | (371) |
| Depreciation | (2,726) | (1,649) |
| Finance expenses | (1,625) | (809) |
| TOTAL EXPENSES | (26,585) | (23,070) |
| NET SURPLUS/(DEFICIT) | (1,383) | (16) |
These abridged audited Financial Statements have been extracted from the full audited Financial Statements for CERA and its controlled entities. The full audited Financial Statements can be extracted from the ACNC (Australian Charities and Not-for-profits Commission) website.
CERA operates as a not-for-profit organisation. Accordingly, accumulated surpluses are held as reserves to support future research projects and operations.